Prediction Markets as chart layers
Turn event odds into time series and compare them against stocks, crypto, commodities, or other markets.
Events turned into charts
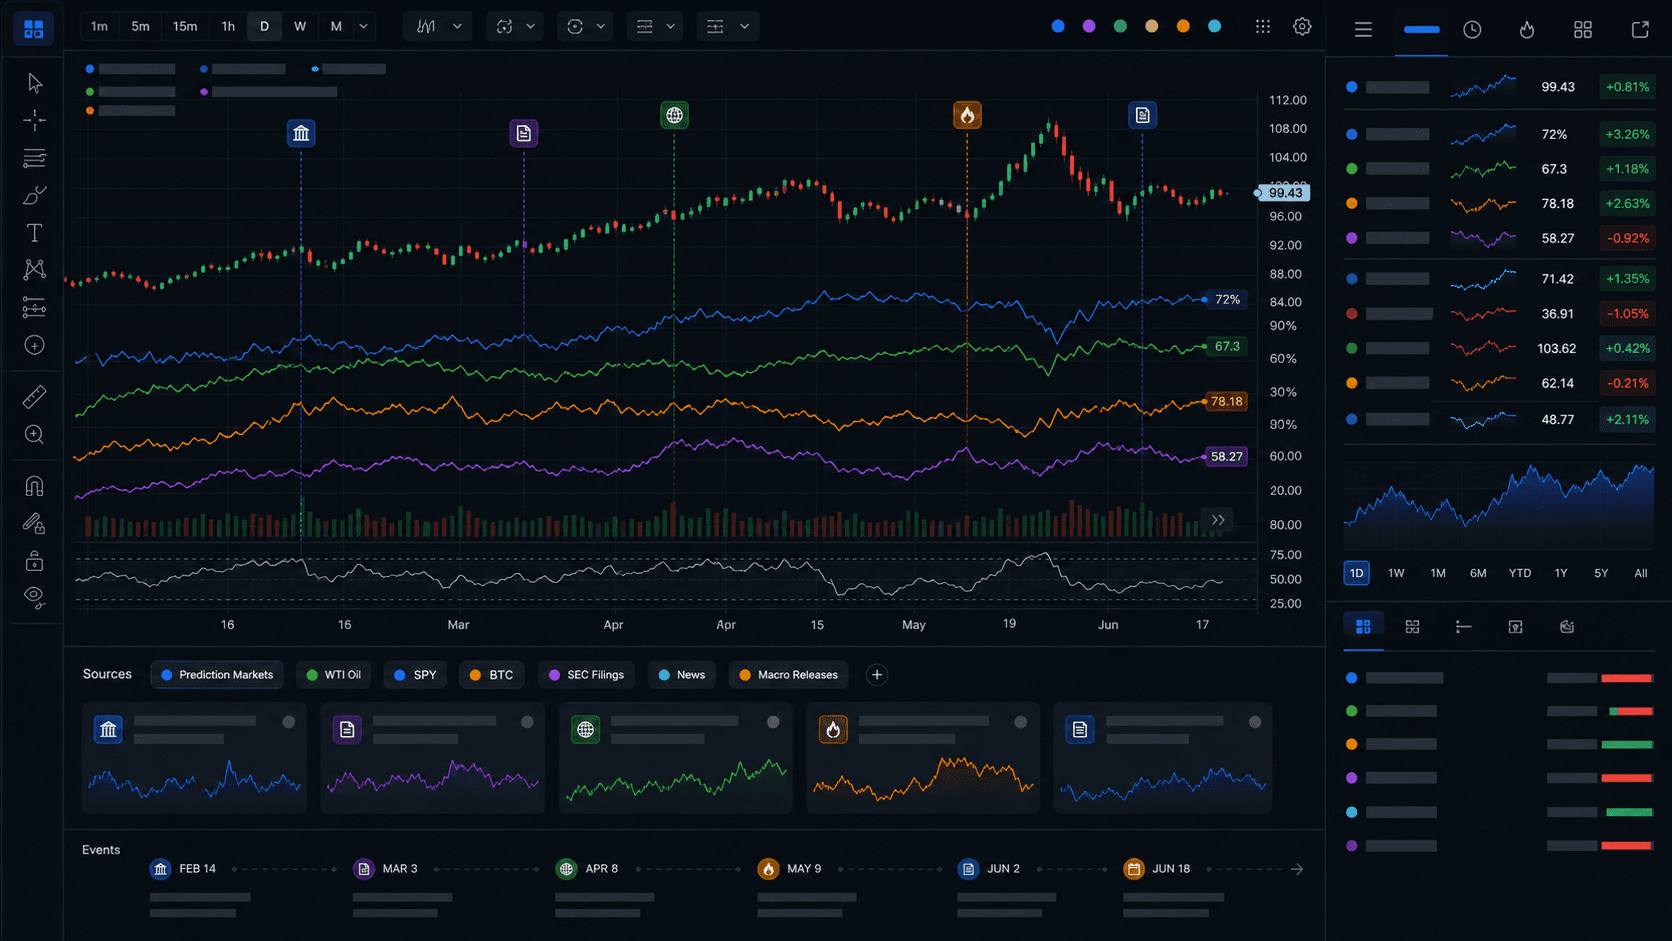
Oddsight Charts turns events, filings, news, and Prediction Markets into charts traders can compare against assets. We are starting with Prediction Markets on top of stocks, crypto, oil, and other event markets.
Why it exists
Traders already compare price, volume, rates, and volatility. Oddsight adds the event layer: Prediction Markets first, then filings, news, earnings calls, social data, macro releases, on-chain data, analyst ratings, and more.
Turn event odds into time series and compare them against stocks, crypto, commodities, or other markets.
Use scale modes built for mixed units so probability and price can be inspected without flattening the story.
Start from an asset, a Prediction Market, or a theme like Fed cuts, Iran ceasefire, oil, elections, or earnings.
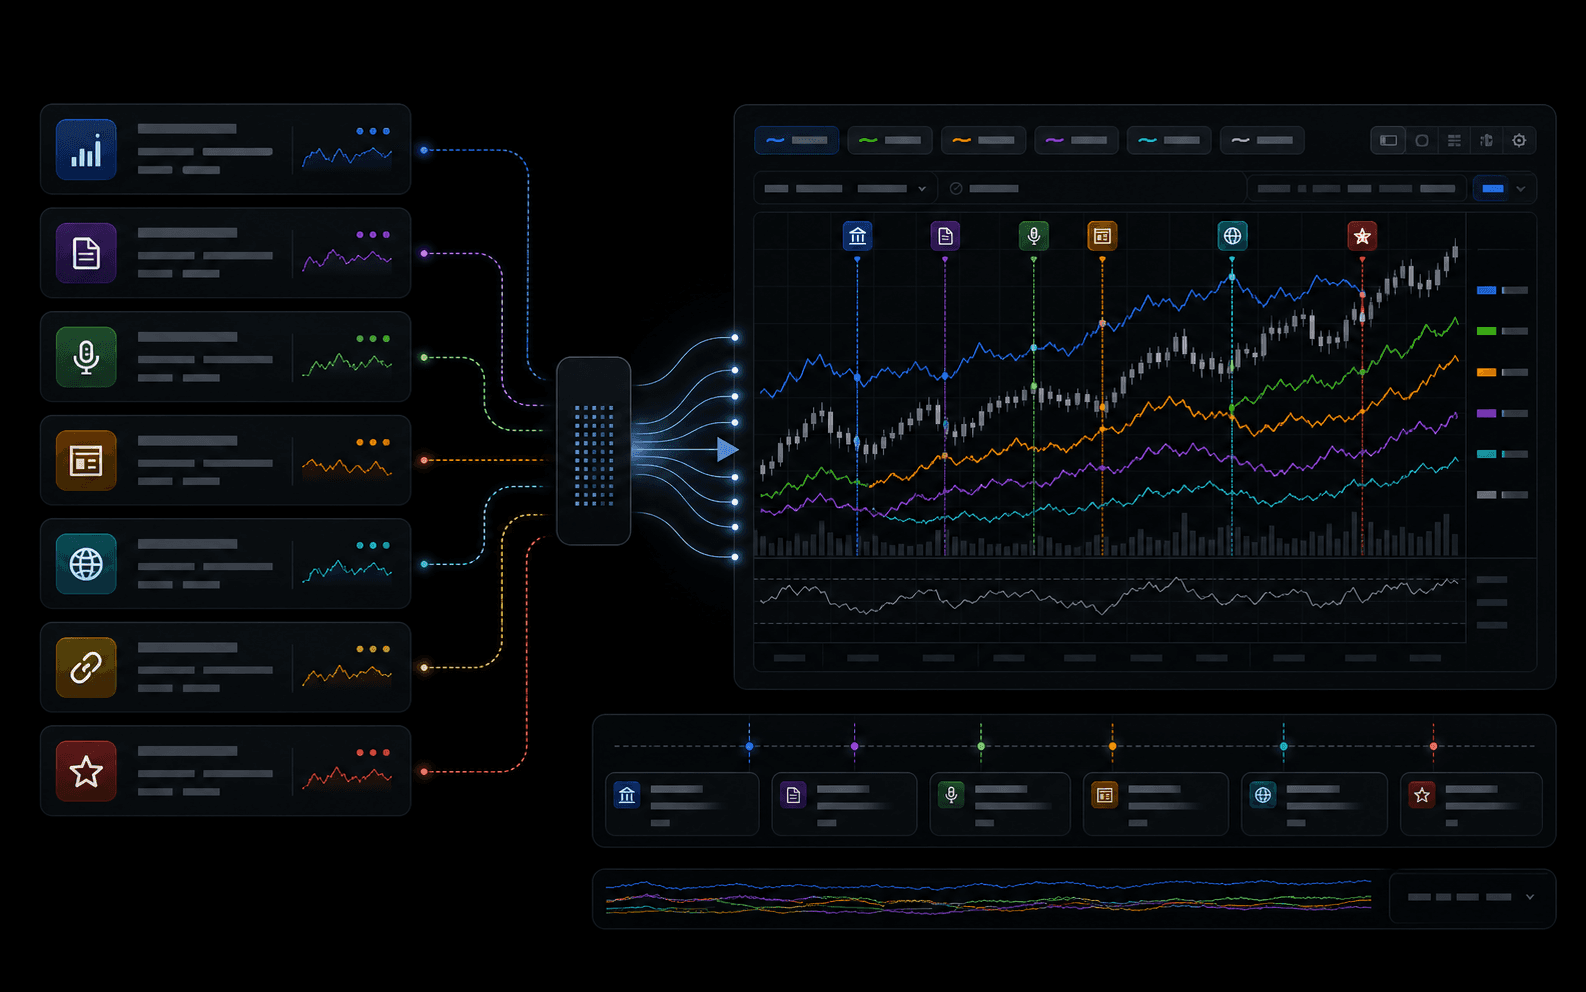
Filings, calls, news, social, macro, on-chain, and analyst data will become chartable overlays too.
Source model
The chart stays the center of the product. Sources become overlays, event pins, and searchable instruments so a trader can test whether odds moved before, after, or with the asset.
First workflows
Advanced chart access
Oddsight Charts is starting with Prediction Market charting and asset overlays. The same framework expands as more event sources come online.